Overview
The typical overall flow of work with the RP2020 PIO Emulator may roughly follow the subsequent pattern.
Start Emulation Server
In a typical development / debugging session, one will begin with starting a server instance.
$ java -jar jar/rp2040pio_server.jar
Emulation Server Daemon
RP2040 PIO Emulator Version 0.1 / jvm 11.0.11 / 55.0
Copyright © 2021 by Jürgen Reuter, Karlsruhe, Germany.

This software comes with ABSOLUTELY NO WARRANTY;
for details please look at the license file that you
should have received together with this software.
This is free software, and you are welcome to
redistribute it under certain conditions;
for details please look at the license file that you
should have received together with this software.

started emulation server at port 2040
Start Monitor Session
Next, an instance of the Monitor client application can be used to load, modify, trace and save PIO programs and inspect the current state of all state machines or any other parts of the emulator.
java -jar rp2040pio_monitor.jar
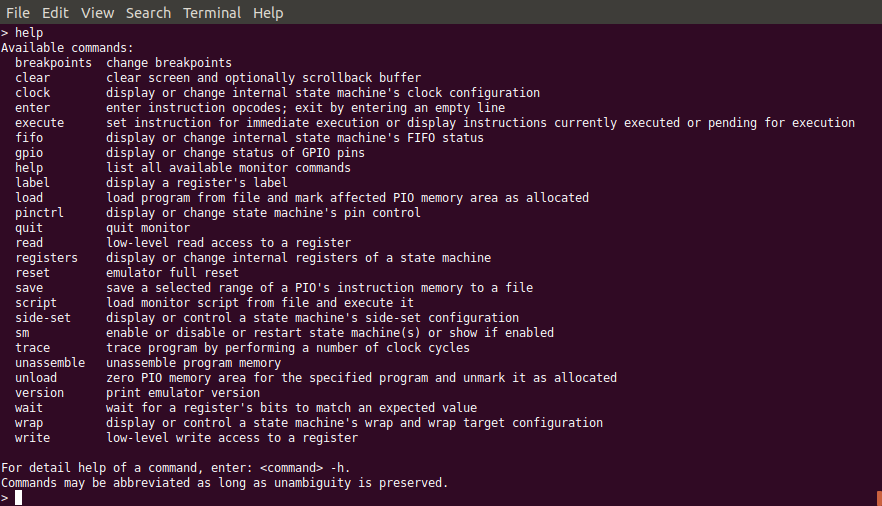
List of Available Monitor Commands
Start the GPIO Observer
For continuously observing the state of registers, entering register queries over and over again on the monitor’s command line is tedious work. Therefore, there are specialized client applications such as for example the GPIO Observer, that continuously visualizes the current state of GPIO pins without further need for interaction.
java -jar rp2040pio_gpioobserver.jar
Additional visual tools are highly useful add-ons that can be run in parallel with the monitor.
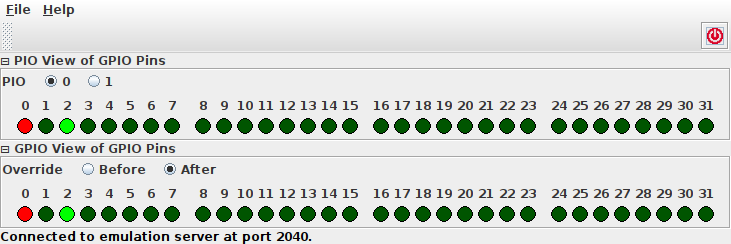
GPIO Observer Application
Start the Code Observer
For tracing programs, it may be useful to automatically see the PIO program’s progress as it proceeds through the code, using the Code Observer client application.
java -jar rp2040pio_codeobserver.jar
This tool is particularly useful in combination with the monitor application’s trace command to follow a PIO program’s control flow.
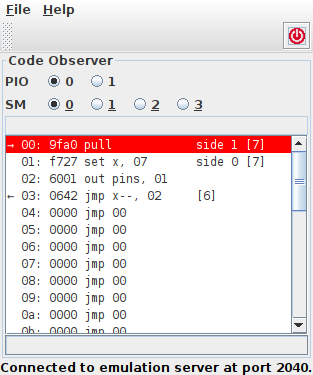
Code Observer Application
Start the FIFO Observer
For observing the FIFO contents of any of the two PIO’s state machines, use the FIFO Observer client application.
java -jar rp2040pio_fifoobserver.jar
This tool is particularly useful in combination with the monitor
application’s trace command to follow a PIO program’s effect on a
state machine’s FIFOs. The monitor also provides the command fifo
for directly modifying a FIFO’s contents and state of joining.
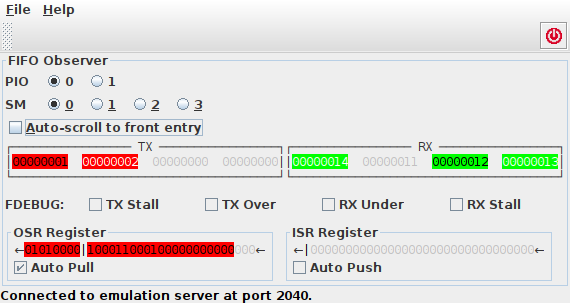
FIFO Observer Application
Create Timing Diagrams
PIO programs are, after all, about processing digital, mostly binary, signals. Consequently, timing diagrams of resulting intermediate or output signals are essential for developing, debugging, understanding and working with PIO programs. Therefore, timing diagrams are a highly valuable tool not only for developing and debugging, but also for documenting functionality and effect of PIO programs. Like all other client applications, Diagram Creator is ready to run as Jar file.
java -jar rp2040pio_diagram.jar
The Diagram Creator client application connects to the RP2040 emulator, and observes and records selected state variables of the emulator’s status while the emulator executes a PIO program. All collected data is visualized as a graphical diagram of signal values over time.
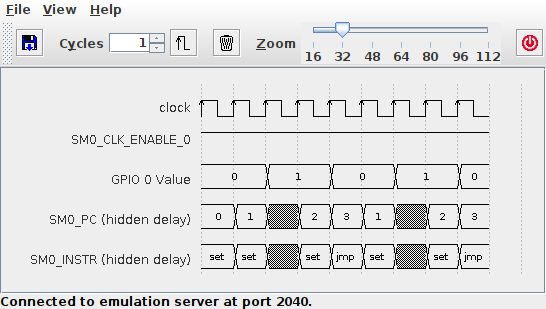
Diagram Creator Application
Note that currently the set of available signals is still limited to a small number of the most intersting emulator state variables. A near-future version of the Diagram Creator application will overcome this restriction and support a lot more of signals – virtually all of the emulator’s internal state variables.
Obtain a Tailored Environment
The combination of these client applications (and, to be expected for the future, still many more applications to emerge) allows for highly individualized and customizable environemnts for developing and debugging PIO programs. The emulator’s flexible client-server architecture provides for a perfect and open ecosystem of client applications – also open for contributions even by third-party developers.