Code Observer
The Code Observer is useful for monitoring the progress of a PIO program running on a state machine. The functionality is roughly comparable with the unassemble command of the monitor application. However, while in the monitor application, one would need to actively run the unassemble command over and over again, the code observer application updates automatically in regular intervals, thus relieving the user from actively polling for the status all the time.
The application is available as Jar file and can be executed from the command line via
java -jar rp2040pio_codeobserver.jar
with optional paramater -p to specify the server port to connect
to. Again, like as for the server, the default port is 2040, if
not specified on the command line.
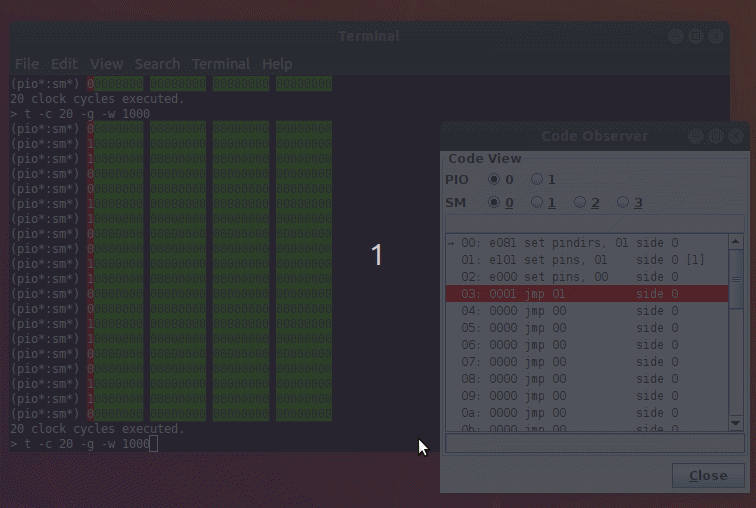
The code observer application displays the code as seen from the selected PIO and state machine. The instruction that the program counter currently points to is highlighted in white color on red background. Usually (if you use the Code Observer together with the monitor), the highlighted instruction is the next to be executed.
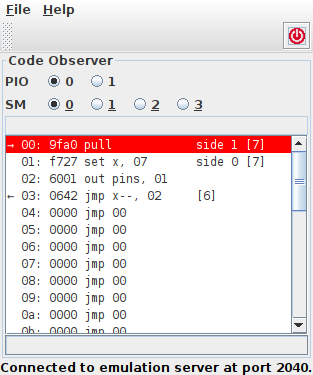
Code Observer Application
Delay
When executing an instruction with delay, the instruction is executed and the program counter updates to the next memory location, but the state machine will first insert delay cycles before executing the next instruction. The Code Observer will display the progress of delay below the list of memory instructions and, since no instructions are executed while delay in progress, the highlighted (i.e. next to be executed) instruction will be grayed out. A grayed out instruction indicates that it is not yet ready for getting scheduled – in this case because delay cycles are still in progress.
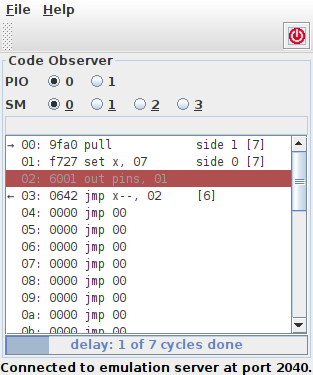
Delay Progress Display
When all delay cycles have been passed, the highlighted instruction is displayed again in white text color on red background.
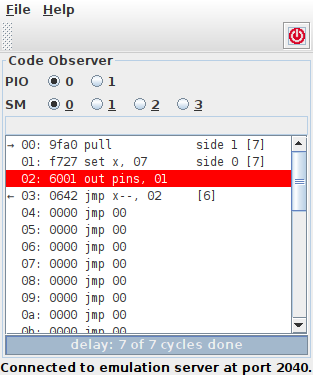
Delay Completed
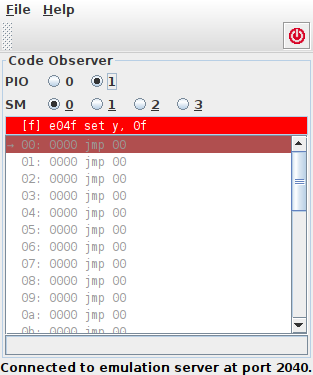
Forced & EXEC’d Instructions
Pending forced and EXEC’d instructions are shown in an additional
separate line atop the scrollable list of memory instructions. This
line is empty unless either a forced or an EXEC’d instruction is
awaiting execution. To distinguish them, a forced instruction is
displayed with prefix [f], while an EXEC’d instruction is
displayed with prefix [x]. If both, a forced and an EXEC’d
instruction are awaiting execution, the forced instruction is shown,
since the state machine will execute it first. Only after that, the
state machine will execute the EXEC’d instruction which will be
displayed as soon as the state machines starts executing the forced
instruction.
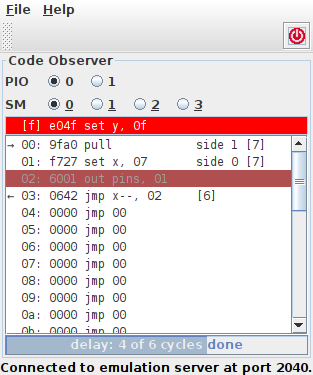
Forced & EXEC’d Instructions
Forced instructions are immediately executed regardless of delay status. Therefore, a pending forced instruction will be displayed as active (i.e. not grayed out) even if delay cycles are still in progress. Following the RP2040 datasheet, she forced instruction’s delay (if any) is ignored.
Enable Status
If a state machine is disabled, it will not execute regular instructions. Consequently, when disabled, the list of memory instructions is grayed out altogether. Disabling a state machine does not stop it to execute forced instructions. Therefore, a forced instruction is not grayed out, when a state machine is disabled.
Disabled State Machine
Further Features
When necessary, the scroll pane automatically scrolls such that the highlighted line of code is visible in the scroll pane’s viewport. Also, wrap and wrap target locations are shown.
The Code Observer is, as the name already suggests, implemented as a read-only client, at least as of now. That is, it uses the emulation server only for read-access of RP2040 registers, but does not do any write access. As such, the this client does not compete with any other clients. In fact, other clients will not notice presence of this client; it operation keeps transparent.
Code Observer in Monitor Session